Structure viewer
Structure datasets list
Thaliadb provides interfaces to display genetic resources structure datasets. The user select in a first time a list of projects to filter availables structure datasets. The result table provides the common features and a direct link makes possible to display the structure data card.
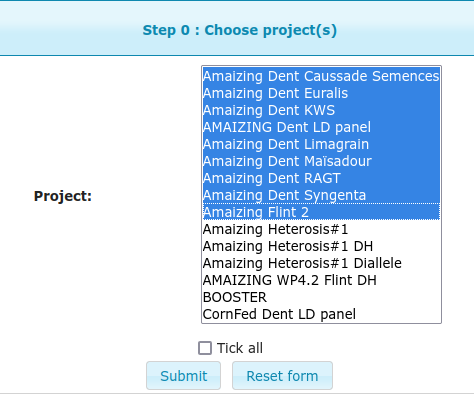
Project list selection

Structures table list
Structure data explorer
Thaliadb also provides advanced interfaces to explore structure information about genetics resources. In a first step the user select a list of projects, like in the figure below, in a second step, the structure dataset to explore. Then data can be filtered regarding a 3 step filter process. First, select a list of groups structure available for the selected dataset. In the second step select a list of seed lots, and the choose your visualization mode by selecting web browser or direct download and checking or nor the option to display accession name related to the seed lot.
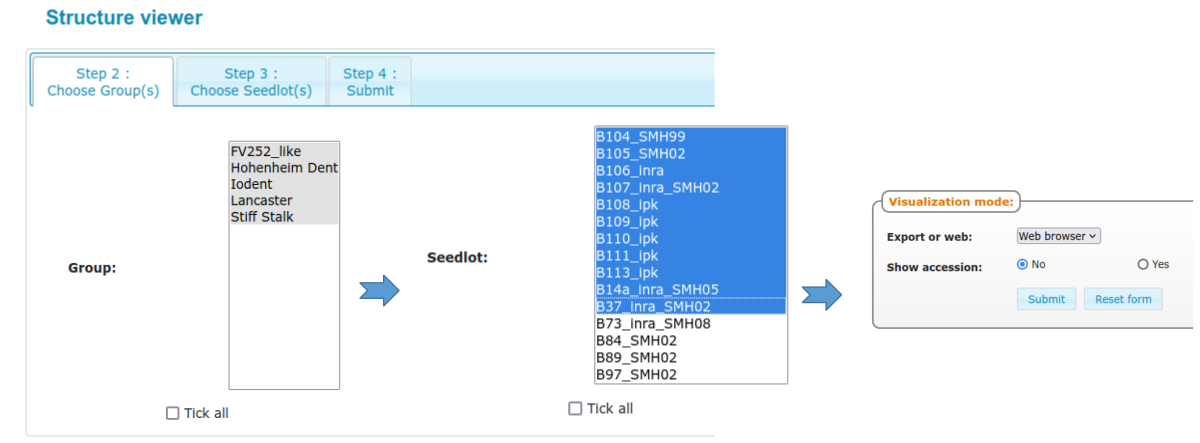
Structure data filters
The resulting table display the structure data for the selected set of genetic resources and structure groups. Direct links to the seed lot card and accession card are available.
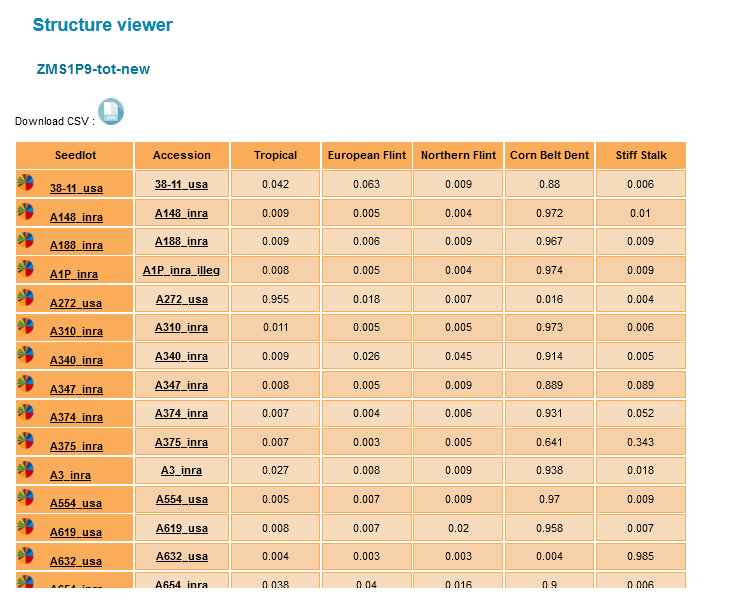
Structure groups table by accession
Moreover, a graphical view of the resource structure can be diplayed in a pie chart that can be saved as a PNG file.
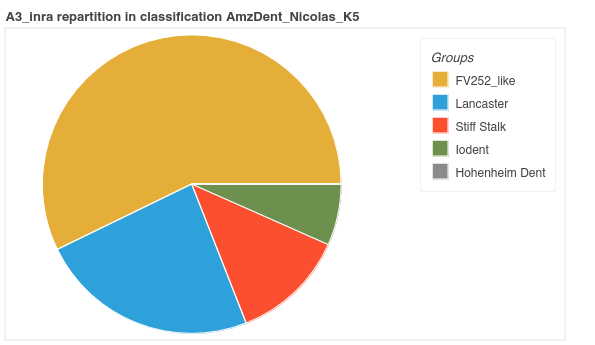
A3_inra structure pie chart
Structure map
Thaliadb also provides a feature to explore genetic resources structure datasets on geographc maps. This feature can work if the fields latitude and longitude of the accession have been filled. In a first step the user select a list of projects, like in the figure Project list selection, in a second step, the structure dataset to explore. Thaliadb display all the geolocated accession. The user can select a group structure and display a graduated colored pointer (blue=0 to red =1) regarding the value of this group for each accession.

Structure map